
Kania, Adrienne M., Weiler, Kailee N., Kurian, Angeline P., Opena, Marielle L., Orellana, Jennifer N. and Stauss, Harald M.. “Activation of the cholinergic antiinflammatory reflex by occipitoatlantal decompression and transcutaneous auricular vagus nerve stimulation” Journal of Osteopathic Medicine, vol. 121, no. 4, 2021, pp. 401-415.
https://doi.org/10.1515/jom-2020-0071
Abstract
Context
The parasympathetic-mediated inflammatory reflex inhibits excessive proinflammatory cytokine production. Noninvasive techniques, including occipitoatlantal decompression (OA-D) and transcutaneous auricular vagus nerve stimulation (taVNS), have been demonstrated to increase parasympathetic tone.
Objectives
To test the hypothesis that OA-D and taVNS increase parasympathetic nervous system activity and inhibit proinflammatory cytokine mobilization and/or production.
Methods
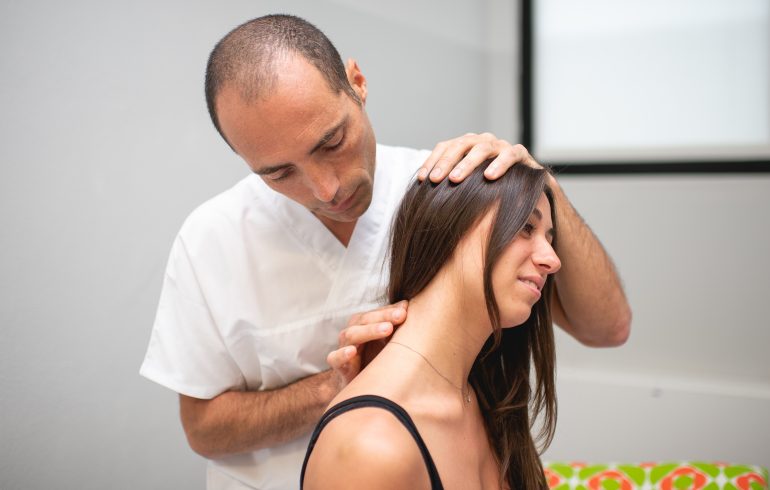
Healthy adult participants were randomized to receive OA-D (5 min of OA-D followed by 10 min of rest; n=8), taVNS (15 min; n=9), or no intervention (15 min, time control; n=10) on three consecutive days. Before and after these interventions, saliva samples were collected for determination of the cytokines interleukin-1β (IL-1β), interleukin-6 (IL-6), interleukin-8 (IL-8), and tumor necrosis factor α (TNF-α). Arterial blood pressure and the electrocardiogram were recorded for a 30-min baseline, throughout the intervention, and during a 30-min recovery period to derive heart rate and blood pressure variability markers as indices of vagal and sympathetic control.
Results
OA-D and taVNS increased root mean square of successive RR interval differences (RMSSD) and high frequency heart rate variability, which are established markers for parasympathetic modulation of cardiac function. In all three groups, the experimental protocol was associated with a significant increase in salivary cytokine concentrations. However, the increase in IL-1β was significantly less in the taVNS group (+66 ± 13 pg/mL; p<0.05) than in the time control group (+142 ± 24 pg/mL). A similar trend was observed in the taVNS group for TNF-α (+1.7 ± 0.3 pg/mL vs. 4.1 ± 1.3 pg/mL; p<0.10). In the OA-D group baseline IL-6, IL-8, and TNF-α levels on the third study day were significantly lower than on the first study day (IL-6: 2.3 ± 0.4 vs. 3.2 ± 0.6 pg/mL, p<0.05; IL-8: 190 ± 61 vs. 483 ± 125 pg/mL, p <0.05; TNF-α: 1.2 ± 0.3 vs. 2.3 ± 0.4 pg/mL, p<0.05). OA-D decreased mean blood pressure from the first (100 ± 8 mmHg) to the second (92 ± 6 mmHg; p<0.05) and third (93 ± 8 mmHg; p<0.05) study days and reduced low frequency spectral power of systolic blood pressure variability (19 ± 3 mmHg2 after OA-D vs. 28 ± 5 mmHg2 before OA-D; p<0.05), a marker of sympathetic modulation of vascular tone. OA-D also increased baroreceptor-heart rate reflex sensitivity from the first (13.7 ± 3.0 ms/mmHg) to the second (18.4 ± 4.3 ms/mmHg; p<0.05) and third (16.9 ± 4.2 ms/mmHg; p<0.05) study days.
Conclusions
Both OA-D and taVNS elicited antiinflammatory responses that were associated with increases in heart rate variability-derived markers for parasympathetic function. These findings suggest that OA-D and taVNS activate the parasympathetic antiinflammatory reflex. Furthermore, an antihypertensive effect was observed with OA-D that may be mediated by reduced sympathetic modulation of vascular tone and/or increased baroreceptor reflex sensitivity.Keywords: blood pressure variability; cytokines; heart rate variability; hypertension; saliva
Biological antiinflammatory drugs, such as tumor necrosis factor-α (TNF-α) antagonists, have revolutionized treatment of chronic inflammatory diseases and largely improved prognosis and quality of life for affected patients [1], [2]. However, the high cost of these agents [3] and potential adverse effects [4] and associated contraindications are prohibitive for a large number of patients. Thus, there is a need for affordable and effective alternative or supplemental treatment strategies. Activation of the cholinergic antiinflammatory pathway [5] within the inflammatory reflex [6] through osteopathic manipulative treatment (OMT) or through direct vagus nerve stimulation may offer an adjunctive therapeutic approach that could allow for lower dosing of biological antiinflammatory drugs, therefore reducing the cost and potential adverse effects of such treatments. The inflammatory reflex is an endogenous mechanism that prevents excessive responses to acute and chronic proinflammatory stimuli such as local tissue damage, invading pathogens, and rheumatoid or autoimmune disorders [5], [6]. This reflex is activated by local inflammatory mediators such as cytokines or pathogen-derived products that are sensed by afferent vagal nerve fibers that project to the central nervous system. This afferent pathway activates the efferent reflex arc that utilizes efferent vagal nerve fibers to inhibit cytokine production in reticular organs, such as the spleen via pathways that may depend on the sympathetic splenic nerve [7] and nicotinic α7 subtype acetylcholine receptors [8]. However, the exact neuronal pathways mediating the efferent reflex response are still a matter of debate [9]. Central nervous system processing of the afferent proinflammatory signals involves activation of postsynaptic M1-muscarinic receptors because it has been demonstrated that intracerebroventricular administration of the M1-muscarinic receptor agonist McN-A-343 decreases serum tumor necrosis factor (TNF) levels during endotoxemia [10]. This M1-muscarinic receptor-mediated pathway can be augmented by inhibition of presynaptic M2-muscarinic receptors that normally inhibit neuronal acetylcholine release [10]. Interestingly, intracerebroventricular administration of the M2-muscarinic antagonist methoctramine not only inhibited the TNF response to endotoxemia but also increased high frequency heart rate variability (HRV) [10], a measure of parasympathetic modulation of cardiac function [11]. Thus, HRV analysis can be utilized as an indirect measure of the activation of the efferent anti-inflammatory arc of the inflammatory reflex.
Some OMT techniques have been demonstrated to increase parasympathetic nervous system activity, as assessed by HRV analysis. Ruffini et al. [12] found that OMT significantly increased high frequency HRV. In that study, the OMT techniques were left at the discretion of the operator but were limited to balanced ligamentous/membranous tension techniques and craniosacral techniques [12]. Fornari et al. [13] found that high frequency HRV was elevated during an arithmetic stress test in subjects who received craniosacral OMT compared to control subjects. Likewise, a study by Henley et al. [14] found less tachycardia and higher high frequency HRV during an orthostatic challenge in subjects receiving OMT as compared to subjects receiving sham or no treatment. In that study, cervical myofascial release techniques were used [14]. Giles et al. [15] demonstrated that cervical OMT significantly increased overall HRV (standard deviation of normal-to-normal intervals) and high frequency HRV and, consequently, concluded that those OMT techniques modulate cardiac parasympathetic nervous system function. The OMT technique used in that study involved cervical soft tissue kneading and stretching followed by suboccipital decompression [15]. Finally, Curi et al. [16] demonstrated that fourth ventricular compression reduced blood pressure in hypertensive patients and that this antihypertensive effect was associated with an increase in high frequency HRV and a shift in autonomic balance to parasympathetic dominance as indicated by a reduction in the low frequency to high frequency ratio of HRV. Taken together, several OMT techniques have been demonstrated to increase parasympathetic activity. However, it is not known whether OMT-induced elevation of parasympathetic nervous system activity also results in activation of the antiinflammatory efferent arc of the inflammatory reflex. If that were the case, OMT techniques could potentially be developed to treat inflammatory conditions.
An alternative noninvasive approach to potentially activate the cholinergic antiinflammatory pathway is transcutaneous auricular vagus nerve stimulation (taVNS) [17], [18]. Evidence for an activation of the parasympathetic nervous system by taVNS comes from studies that utilized HRV analysis, microneurography, and baroreceptor reflex analysis [19], [20], [21], [22]. Thus, as with OMT, there is a possibility that taVNS may potentially be useful in the treatment of inflammatory conditions. Indeed, taVNS has been suggested to elicit antiinflammatory responses in depression [23], postoperative ileus and endotoxemia [24], and in Parkinson’s disease [25]. In a recent metaanalysis of OMT techniques in inflammatory diseases [26], only two of 10 included studies utilized techniques (balanced ligamentous tension in the occipitoatlantoid and cervicothoracic junctions, and suboccipital decompression) that have been demonstrated to increase parasympathetic tone, while the other eight studies relied on rib raising, visceral, sacral, and lymphatic pump techniques. Overall, the results of the metaanalysis were inconsistent [26], which may be related to the fact that the majority of included studies did not utilize OMT techniques that have the potential to activate the antiinflammatory efferent arc of the inflammatory reflex.
Thus, the hypothesis of our study was that the OMT technique of decompression of the occipitoatlantal (OA-D) junction and noninvasive taVNS, both of which have been demonstrated to increase parasympathetic activity [12], [13], [14], [15], [16], [19], [20], [21], [22] would also elicit an antiinflammatory response as indicated by a reduction in proinflammatory cytokines. Our rationale for selecting OA-D technique and taVNS is that these techniques are known to increase parasympathetic tone and therefore have the potential to activate the cholinergic antiinflammatory reflex. Importantly, it has been demonstrated that chronic inflammatory diseases like lupus are associated with reduced heart rate variability markers of parasympathetic tone, even in the absence of overt cardiac involvement and symptoms [27]. Thus, it has been suggested that interventions that increase parasympathetic tone also reduce inflammation in chronic inflammatory disorders [28]. Several OMT techniques have been demonstrated to increase parasympathetic tone. Curi et al. [16] demonstrated that the technique of fourth ventricle compression is associated with an increase in high-frequency HRV and a shift in autonomic balance to parasympathetic dominance. Likewise, Giles et al. [15] demonstrated a marked increase in high frequency HRV when performing suboccipital decompression, also suggesting increased parasympathetic tone. To our knowledge, there has been no prior study comparing the effectiveness of different OMT techniques in activating the parasympathetic nervous system. We elected to utilize the OA-D technique vs. the fourth ventricle compression technique because the fourth ventricle compression technique is considered a more advanced technique compared to OA-D, which could be utilized by any osteopathic physician as it is included in the curriculum at all colleges of osteopathic medicine. As an experimental approach, we applied OA-D or taVNS to healthy study participants on three consecutive days. The effect of these interventions on parasympathetic modulation of cardiac function assessed by HRV and on inflammation assessed by salivary cytokine content was compared to the responses in participants who underwent a time control without OA-D or taVNS application.
Methods
Study design
The experiments of this study were conducted as part of the Burrell College medical student summer research program in 2019 (June 2019 to September 2019). While this particular study was not publicly registered, an ongoing follow-up study is registered with ClinicalTrials.gov (NCT04177264). The study was approved by the Institutional Review Board at Burrell College of Osteopathic Medicine (IRB# 0046_2019) and all study participants provided written informed consent. Subjects were compensated for their time and effort with VISA gift cards in the amount of $20.00 per study day, for a total amount of $60.00 for all three study days.
The study design and experimental protocol is shown in Figure 1. The study consisted of three experimental groups: (1) OA-D; (2) taVNS; and (3) time control (no intervention). After written consent was obtained, subjects were randomly assigned to a study group. For randomization into the three study groups, a six-sided die was rolled and numbers of one or two corresponded to the control group, numbers of three or four corresponded to the OA-D group, and numbers of five or six corresponded to the taVNS group. All subjects participated in three consecutive study days. At the beginning of the first study day, body weight and height were determined and on all three study days, upper-arm blood pressure (Omron 10 Series; Omron Healthcare, Inc.) was measured. Saliva samples were collected (Saliva Collection Aid; Salimetrics, LLC) at the beginning and end of the experiments on each study day for determination of salivary cytokines. On each of the three study days, subjects were instrumented with electrocardiogram (ECG) electrodes and an inflatable finger cuff for noninvasive continuous blood pressure monitoring (Finapres Finometer Pro; Finapres Medical Systems). During the protocol, subjects rested in the supine position on OMT examination tables and were instructed to avoid unnecessary movements to ensure high quality ECG and blood pressure signals. Initially, a baseline recording of the ECG and arterial blood pressure was obtained for 30 min. Then OA-D (Group 1: 5 min of OA-D followed by 10 min of rest), taVNS (Group 2: 15 min of taVNS), or no intervention (Group 3: 15 min of rest) were applied, after which a final recovery recording of the ECG and arterial blood pressure was obtained for another 30 min. Following the baseline recording and following the 15-min intervention, the finger cuff was deflated for 2–3 min and study participants were allowed to sit up or move their extremities.

Figure 1:
Experimental protocol. The study consisted of three study days. At the beginning of the first study day, written consent was obtained, potential exclusion criteria were assessed through a questionnaire, and height, weight, and arm cuff blood pressure were measured. On each study, day saliva samples were collected at the beginning and end of the study day, for a total of six saliva samples from each participant. Hemodynamic recordings of arterial blood pressure (finger plethysmography) and heart rate (ECG) were obtained on each study day. The experimental protocol during the hemodynamic recordings on each study day consisted of a 30 min baseline recording, a 15 min intervention, and a 30 min recovery recording. In three experimental groups, the interventions consisted of either 5 min of occipitoatlantal decompression (OA-D) followed by 10 min of rest (OA-D group), or 15 min of transcutaneous auricular vagus nerve stimulation (taVNS group), or 15 min of rest (control group). The shown example of the hemodynamic recording is from a participant in the OA-D group.
Subjects
The study was conducted in healthy, adult (minimum age, 18 years) subjects of both genders. Exclusion criteria included: pregnancy; any medication that interferes with the autonomic nervous system or the immune system (e.g., beta-blockers, steroids, TNF-α inhibitors); any medical condition that affects the autonomic nervous system or the immune system (e.g., autonomic neuropathy, pure autonomic failure, rheumatic or autoimmune diseases, acquired autoimmune deficiency syndrome); diabetes; and current drug or alcohol abuse.
OMT intervention
The overall premise of the study was that OMT techniques that increase parasympathetic nervous system activity would also activate the cholinergic antiinflammatory reflex. OA-D is an osteopathic technique that focuses on treating an articular compression between the occiput and the atlas, which may improve conditions relating to the path of the vagus nerve as it exits the skull. This technique has been demonstrated to markedly increase high frequency HRV, suggesting increased cardiac parasympathetic modulation [15]. For OA-D, the subjects were lying in the supine position on an OMT examination table, while the investigator cradled the subjects’ heads with their hands and finger pads along the inferior aspect of inion, reaching toward the occipitoatlantal joint. The investigator then applied gentle anterior and cephalad traction to the occiput, while bringing the elbows together. This motion resulted in supination of the hands and separation of the fingers, creating an anterolateral force vector to either side of the foramen magnum [29]. The gentle anterior and cephalad traction was then maintained for 5 min. All investigators performing OA-D (K.N.W., A.P.K., M.L.O., and J.N.O.) had practiced modulating their palpatory efforts, specifically in light palpation, while applying the technique of OA-D such that there was no difference among their application of OA-D when evaluated by a of senior investigators with many years of experience in OMT (A.M.K.).
Transcutaneous auricular vagus nerve stimulation (taVNS)
Current literature [19], [20], [21], [22] strongly suggest that taVNS increases cardiac parasympathetic tone and therefore may also activate the cholinergic antiinflammatory reflex [10]. A bipolar clip electrode connected to a transcutaneous electrical nerve stimulator (EMS 7500; Current Solutions, LLC) was applied to the cymba conchae that is innervated by the auricular branch of the vagus nerve (Arnold’s nerve) [30]. The clip electrode was applied to the ear lobe such that the cathode was placed at the cavum of the concha and the anode was placed at the opposing site of the back of the auricle that is also innervated by the vagus nerve. Badran et al. [31] studied different stimulation frequencies (1, 10, and 25 Hz) and stimulation pulse widths (100, 200, and 500 µs) and found that the combination of 10 Hz and 500 µs resulted in the greatest bradycardic effect. Since the longest pulse width of the EMS 7500 device is 300 µs, we used a combination of 10 Hz stimulation frequency and 300 µs pulse width for the current study. The stimulation current was determined individually for each subject by slowly increasing the stimulation current until the subjects felt a mild tingling sensation at the site of the electrode. Then the current was gradually reduced until the tingling sensation disappeared or was just barely felt. This current was then used for 15 min of taVNS.
Baroreceptor-heart rate reflex analysis
The baroreceptor–heart rate reflex sensitivity was calculated using the sequence technique as first described by Bertinieri et al. [32]. Briefly, the freely available HemoLab software [33] was used to identify spontaneously occurring sequences of four or more consecutive heart beats, where systolic blood pressure and pulse interval change in the same direction. The average of the slopes of all identified sequences (changes in pulse interval on y-axis; changes in systolic blood pressure on x-axis) is a measure of the baroreceptor–heart rate reflex sensitivity. This technique has been found to be reliable [34] when compared to the gold standard of the Oxford method [35]. The premise of this study is that activation of the parasympathetic nervous system by OA-D or taVNS elicits an antiinflammatory response; thus, we were primarily interested in parasympathetic baroreflex control. Since the parasympathetic nervous system – other than the sympathetic nervous system – can affect heart rate rapidly within one heartbeat, we did not use a time delay between the blood pressure and heart rate time series when identifying baroreflex sequences.
Parasympathetic modulation of cardiac function
Parasympathetic modulation of cardiac function was assessed by HRV analysis. Specifically, the time-domain HRV parameter of the root mean square of successive RR interval differences (RMSSD) and the frequency-domain HRV parameter of high frequency spectral power were determined. These two HRV parameters are well-established measures of parasympathetic modulation of cardiac function [11]. First, all RR intervals were derived from the ECG recordings (sample rate 1,000 Hz) for the 30 min of baseline recording, the recordings during the interventions (15 min for control and taVNS and 5 min for OA-D), and for the 30 min of recovery recording that followed the intervention. For RMSSD, these beat-by-beat RR intervals were segmented into 5 min segments with 50% overlap. From these segments, RMSSD was calculated using the HemoLab software [33]. The RMSSD values from all overlapping segments within the baseline, intervention, and recovery periods were averaged for statistical analysis. For frequency domain HRV analysis, beat-by-beat heart rate values were derived for the three sections of the experimental protocol (baseline, intervention, recovery). These beat-by-beat heart rate time series were spline interpolated and resampled at an equidistant sampling rate of 25 Hz. From these 25 Hz time series, power spectra were calculated for overlapping segments (50% overlap, 4,096 data points, 164 s). The power spectra of the overlapping segments for each subject and each experimental condition (baseline, intervention, recovery) were averaged for statistical analysis. High frequency spectral power was calculated as the area under the curve of the power spectra in the frequency band of 0.15–0.4 Hz.
Sympathetic modulation of vascular tone
Analysis of sympathetic modulation of vascular tone was also performed using the HemoLab software [33]. Using the blood pressure waveforms obtained from the Finapres device (1,000 Hz sampling rate), beat-by-beat systolic blood pressure values were derived for the three sections of the experimental protocol (baseline, intervention, recovery). These beat-by-beat time series were spline interpolated and resampled at an equidistant sampling rate of 25 Hz. From these 25 Hz time series, power spectra were calculated for overlapping segments (50% overlap, 4,096 data points, 164 s). The power spectra of the overlapping segments of each subject and each experimental condition (baseline, intervention, recovery) were averaged for statistical analysis. Low frequency spectral power of systolic blood pressure variability (LFSYS), a measure of sympathetic modulation of vascular tone [36], [37], was calculated as the area under the curve of the power spectra in the frequency range of 0.04–0.15 Hz.
Determination of salivary cytokines
Saliva samples were collected before and after the experiments on all three study days using the SalivaBio Saliva Collection Aid (Salimetrics, LLC; Carlsbad, CA). Saliva flow rate was determined as the ratio of the saliva volume produced to the time needed to produce that volume. All saliva samples were stored at −80 °C. Upon completion of the study, the saliva samples were shipped to Salimetrics for analysis (Salivary Cytokine Panel; Salimetrics, LLC). The cytokine panel included interleukin-1β (IL-1β, detection range: 0.05–2,256 pg/mL), interleukin-6 (IL-6, detection range: 0.06–3,068 pg/mL), interleukin-8 (IL-8, detection range: 0.07–2,336 pg/mL), and TNF-α (detection range: 0.04–1,360 pg/mL) and were determined by enzyme-linked immunosorbent assay. All measured cytokine levels were within the detection range of the assays.
Statistical analyses
All data are shown as means ± standard error of the mean (SEM). For statistical comparison between groups, a one-way analysis of variance (ANOVA) for independent measures was used. Post-hoc Fisher tests were used if the ANOVA revealed statistical significance to identify differences between individual groups. For statistical comparison between data obtained on the three study days, repeated-measures one-way ANOVA was used. In case of statistical significance in the ANOVA, post-hoc Fisher tests were used to identify significant differences between individual study days. For statistical comparison between different phases of the experimental protocol within a study day (i.e., baseline recording, intervention, or recovery recording) repeated-measures ANOVA was used. In case of statistical significance in the ANOVA, post-hoc Fisher tests were used to identify significant differences between the phases of the experimental protocolInstead of a comprehensive power analysis for all parameters and for all statistical comparisons made, we present the power analysis for the comparison for the IL-1β responses among the three experimental groups as a representative example. We chose this cytokine because our conclusion of an antiinflammatory effect of taVNS is primarily based on the IL-1β responses. The power analysis was performed using the power.anova.test function in the R statistical analysis software [38] according to Cohen [39]. The power analysis showed that the statistical power for comparing the IL-1β response between the three experimental groups was 59.4% at the p=0.05 level and 71.5% at the p=0.10 level. As with all statistical tests, there is a tradeoff between the p value (alpha error) and the statistical power (1-beta error). To obtain acceptable powers, we chose to present statistical results at both the p=0.05 and p=0.10 levels as appropriate. We chose to use the terms “trend” or “tended” for results that only provided an acceptable statistical power (>70%) at the p=0.10 level.
Results
Participant characteristics
A total of 27 study participants were enrolled in the study (n=10 for control; n=8 for OA-D; n=9 for taVNS). Two participants (1 from the OA-D group and one from the taVNS group) were excluded from hemodynamic analyses because the ECG revealed sick sinus syndrome or atrial fibrillation, respectively. Two additional subjects (both from the control group) did not complete all three study days.
The age, gender distribution, and BMI of the subjects in the three experimental groups are provided in Table 1. There were more women (20) than men (7). The age of the participants (mean, 52.7 ± 3.8 years) was not statistically different between the three groups. However, body mass index (BMI) was higher in the taVNS group (mean, 31.0 ± 2.4 kg/m2; p<0.05) compared with the control group (mean, 24.5 ± 1.2 kg/m2). BMI of the subjects in the OA-D group (mean, 27.0 ± 1.4 kg/m2) was not different from the BMI of the subjects in the two other groups.Table 1:Participant characteristics.
| Parameter | Control (n=10) | OA-D (n=8) | taVNS (n=9) |
|---|---|---|---|
| Sex | 8 women/2 men | 6 women/2 men | 6 women/3 men |
| Age in years* | 55 ± 6 (24–81) | 51 ± 9 (23–87) | 51 ± 6 (22–70) |
| BMI in kg/m2* | 24.5 ± 1.2 (19.8–30.2) | 27.0 ± 1.4 (21.1–31.5) | 31.0 ± 2.4 (21.3–44.3)† |
Hemodynamic effects of OA-D and taVNS
In the time control group, baseline mean arterial blood pressure (MAP) was similar on all three study days. In contrast, baseline MAP was lower on the second and third study day compared to the first study day in the OA-D group, but not in the taVNS group (Figure 2). While there was no change in MAP throughout the experimental protocol on individual study days in the control group, MAP increased toward the end of the experimental protocol in the OA-D and taVNS groups (pooled data, Figure 2). The antihypertensive effect of OA-D observed during the baseline recordings on the second and third study days compared with the baseline recording on the first study day was confirmed by the blood pressure readings obtained at the beginning of each study day using an arm cuff-based blood pressure monitor. These blood pressure readings showed statistically lower diastolic blood pressure values on the second (mean, 80 ± 4 mmHg; p<0.05) and third (mean, 79 ± 5 mmHg; p<0.05) study days compared with the first study day (mean, 84 ± 5 mmHg) in the OA-D group, but not in the time control or taVNS groups. Heart rate generally decreased during the time course of the experimental protocol in all three groups and on all three study days with no significant differences between groups.

Figure 2:
Effect of the control intervention (CTR, top), occipitoatlantal decompression (OA-D, middle), and transcutaneous auricular vagus nerve stimulation (taVNS, bottom) on mean arterial blood pressure (MAP) on each of the three study days and for the data from all three study days pooled. Changes (Δ) from the baseline values on the first study day are shown. The numbers next to the baseline values of each study day are the absolute baseline MAP values ± SEM (in mmHg) and number of participants (or number of experiments for the pooled data), respectively. Data are shown as means ± standard error of the mean (SEM). †: p<0.05 vs. baseline MAP value on the first study day; ‡: p<0.05 vs. baseline MAP value on the same study day.
Effects of OA-D and taVNS on baroreceptor-heart rate reflex sensitivity
In the time control and taVNS groups, baroreceptor-heart rate reflex sensitivity (BRS) did not change significantly throughout the three study days or during the experimental protocol on each study day (Figure 3). In contrast, BRS baseline values increased significantly from the first to the second and third study days in the OA-D group. Furthermore, pooling the data from all three study days revealed that BRS increased significantly during the acute OA-D intervention, but not during taVNS or during the control intervention.

Figure 3:
Effect of the control intervention (CTR, top), occipitoatlantal decompression (OA-D, middle), and transcutaneous auricular vagus nerve stimulation (taVNS, bottom) on baroreceptor-heart rate reflex sensitivity (BRS) on each of the three study days and for the data from all three study days pooled. Changes (Δ) from the baseline values on the first study day are shown. The numbers next to the baseline values of each study day are the absolute baseline BRS values ± SEM (in ms/mmHg) and number of participants (or number of experiments for the pooled data). Data are shown as means ± standard error of the mean (SEM). †: p<0.05 vs. baseline BRS value on the first study day; ‡: p<0.05 vs. baseline BRS value on the same study day.
Cardiac autonomic responses to OA-D and taVNS
In the time control group, there were no significant differences for RMSSD (Figure 4) or high frequency spectral power of HRV (Figure 5) between the baseline values on the three experimental days or throughout the experimental protocol (baseline, intervention, recovery) on each individual study day. In contrast, OA-D caused a significant increase in baseline RMSSD (mean ± standard error of the mean SEM,+19 ± 10 ms; p<0.05) on the second compared to the first study day (Figure 4) and trends for higher high frequency spectral power of HRV on the second (mean ± SEM,+2.2 ± 1.6 bpm2; p=0.08) and third (mean ± SEM,+2.0 ± 1.1 bpm2; p=0.11) study days (Figure 5). These findings suggest that OA-D increases parasympathetic modulation of cardiac function and that this effect persists into the following day. In the taVNS group, RMSSD increased significantly during the recovery period compared to the baseline recording on the second study day (Figure 4). Pooling the data from all three study days confirmed this increase in RMSSD (mean ± SEM, +5.0 ± 1.6 ms; p<0.05) at the end compared to the beginning of the experimental protocol in the taVNS group. Consistent with these RMSSD responses to taVNS, pooling the data from all three study days revealed that taVNS increased high frequency spectral power of HRV during the recovery period at the end of the experimental protocol compared to the baseline recording at the beginning of the experimental protocol (mean ± SEM,+0.65 ± 0.34 bpm2; p<0.05; Figure 5). These findings suggest that taVNS increases cardiac parasympathetic tone. However, this cardiac autonomic effect of taVNS did not last into the next day because no significant changes in RMSSD or high frequency spectral power of HRV were observed during the baseline recordings of the second and third study days compared to the first study day. While OA-D appears to have had a more chronic effect on parasympathetic tone that lasted into the next study day, taVNS appeared to elicit a more acute effect because it was most apparent during the recovery period and did not persist into the following study day.

Figure 4:
Effect of the control intervention (CTR, top), occipitoatlantal decompression (OA-D, middle), and transcutaneous auricular vagus nerve stimulation (taVNS, bottom) on root mean square of successive differences (RMSSD) on each of the three study days and for the data from all three study days pooled. Changes (Δ) from the baseline values on the first study day are shown. The numbers next to the baseline values of each study day are the absolute baseline RMSSD values ± SEM (in ms) and number of participants (or number of experiments for the pooled data). Data are shown as means ± standard error of the mean (SEM). †: p<0.05 vs. baseline values on the first study day; ‡: p<0.05 vs. baseline values on the same study day.

Figure 5:
Effect of the control intervention (CTR, top), occipitoatlantal decompression (OA-D, middle), and transcutaneous auricular vagus nerve stimulation (taVNS, bottom) on high frequency (HF) heart rate (HR) variability on each of the three study days and for the data from all three study days pooled. Changes (Δ) from the baseline values on the first study day are shown. The numbers next to the baseline values are absolute baseline values for HF spectral power ± SEM (units as on y-axes) and number of participants (or number of experiments for the pooled data). Data are shown as means ± standard error of the mean (SEM). (†): p<0.10 vs. baseline values on the first study day; ‡: p<0.05 vs. baseline values; (‡): p<0.1 vs. baseline values.
Effects of OA-D and taVNS on sympathetic modulation of vascular tone
Low frequency systolic blood pressure variability (LFSYS) has been demonstrated to be modulated by fluctuations in sympathetic-medicated vasomotor tone [40], [41]. In the time control group and taVNS groups, no statistically significant changes in LFSYS were observed throughout the experimental protocol or between individual study days (Figure 6). However, in the OA-D group, a marked decrease in LFSYS was apparent during the application of OA-D and during the recovery period at the end of the experimental protocol. This reduction in sympathetic modulation of vascular tone in the OA-D group did not persist into the next study day because the baseline values on the second and third study days were not different from the baseline values on the first study day. This finding suggests that OA-D acutely reduces sympathetic vascular tone.

Figure 6:
Effect of the control intervention (CTR, top), occipitoatlantal decompression (OA-D, middle), and transcutaneous auricular vagus nerve stimulation (taVNS, bottom) on low frequency systolic blood pressure variability (LFSYS) on each of the three study days and for the data from all three study days pooled. Changes (Δ) from the baseline values on the first study day are shown. The numbers below the baseline values are absolute baseline values for LFSYS ± SEM (in mmHg2) and number of participants (or number of experiments for the pooled data). Data are shown as means ± standard error of the mean (SEM). ‡: p<0.05 vs. baseline values on the same study day.
Glandular autonomic responses to OA-D and taVNS
Parasympathetic innervation of the salivary glands increases salivary flow rate primarily through M3-muscarinic receptor stimulation [42]. In all three study groups, saliva flow rate did not differ before and after the experimental protocol on any study day. Only in the time control group saliva flow rate increased from the first to the second (mean ± SEM, +0.23 ± 0.09 mL/min; p<0.05) study day. No significant changes in saliva flow rate from the first to subsequent study days were observed in the OA-D or taVNS groups.
Effects of OA-D and taVNS on salivary cytokines
In some study participants, salivary cytokine plasma levels were excessively high. Markedly elevated salivary cytokine levels have been reported in patients with periodontal diseases [43], [44]. Since we did not assess oral health status, we defined outliers as cytokine values that were higher than 2 standard deviations above the mean of the respective baseline cytokine levels on the first study day (before any interventions were done). Outliers defined by this criterion were excluded from data analysis.
The baseline concentrations of all four salivary cytokines (IL-1β, IL-6, IL-8, and TNF-α) on each of the three study days and for the three study days pooled are listed in Table 2. Baseline cytokine levels on individual study days did not differ significantly (p<0.05) between groups (Table 2). However, when the data from all three study days were pooled baseline IL-1β (p<0.05) and TNF-α (p<0.10) levels were lower in the taVNS group than in the time control group. Importantly, in the OA-D group, baseline salivary IL-6, IL-8, and TNF-α concentrations were significantly (p<0.05) less on the third study day compared to the first study day (Table 2), suggesting that successive OA-D applications elicited an antiinflammatory effect during the 3-day protocol.
Table 2: Baseline salivary cytokine concentrationsa.
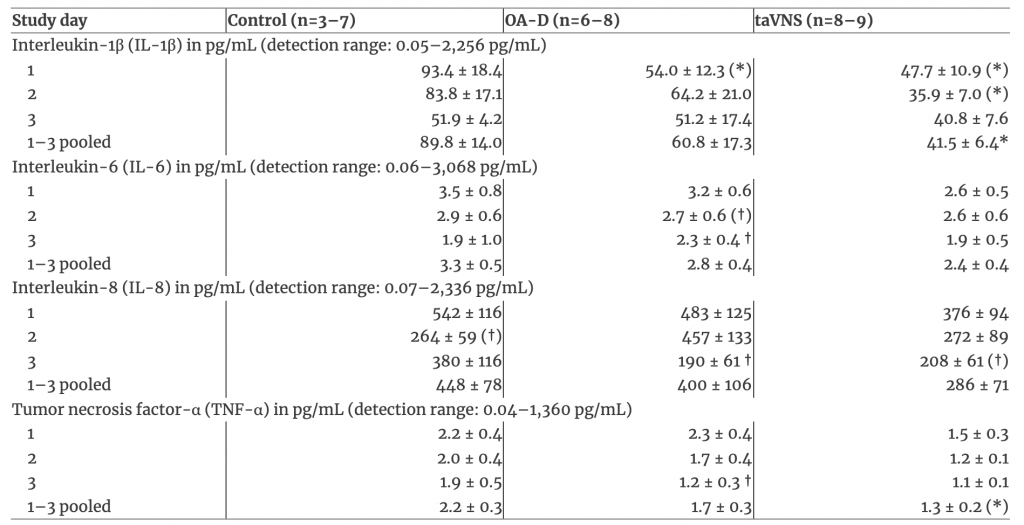
Figure 7 shows the changes (Δ values) in salivary cytokine levels from the beginning to the end of each study day as well as for the data from all three study days pooled for the three experimental groups. Generally, salivary cytokines levels (IL-1β, IL-6, IL-8, TNF-α) increased from the beginning to the end of the experimental protocol on each study day (i.e., all Δ values in Figure 7 are positive). Specifically, when the data from all three study days were pooled, all four cytokines increased significantly (p<0.05) from the beginning to the end of the protocol in all three experimental groups. This finding suggests that the experimental protocol elicited a proinflammatory response. However, pooling the data from all three study days also revealed that the increase in salivary cytokines elicited by the experimental protocol differed among groups. In the taVNS group, the increase in salivary IL-1β was significantly (p<0.05) less than in the control group. A similar trend (p<0.1) was observed for TNF-α in the taVNS group. IL-6 and IL-8 increased similarly in all three experimental groups. These findings indicate that the experimental protocol was associated with a proinflammatory response that was blunted to some extent by taVNS. There were no significant differences in the increases in cytokine levels between the three study days in any group, suggesting that the proinflammatory effect of the experimental protocol was consistent on all three study days.

Figure 7:
Effect of the control intervention (left), occipitoatlantal decompression (OA-D, middle), and transcutaneous auricular vagus nerve stimulation (taVNS, right) on inflammatory salivary cytokines interleukin-1β (IL-1β), interleukin-6 (IL-6), interleukin-8 (IL-8), and tumor necrosis factor-α (TNF-α) on each of the three study days and for the data from all three study days pooled (bars). Differences (Δ) between the cytokine levels following the experimental protocol minus the cytokine levels before the experimental protocol are shown. Data are shown as means ± standard error of the mean (SEM). *: p<0.05 vs. control group; (*): p<0.10 vs. control group.
Discussion
The major finding of this study is that both noninvasive taVNS and OA-D, an OMT technique known to increase parasympathetic tone, elicited changes in salivary cytokines consistent with antiinflammatory actions. Specifically, taVNS blunted the increase in salivary interleukin-1β (IL-1β) that was associated with the experimental protocol (Figure 7) and successive applications of OA-D on three consecutive days reduced salivary IL-6, IL8, and TNF-α baseline levels on the third compared to the first study day (Table 2). A secondary finding was that OA-D lowered diastolic and mean (Figure 2) blood pressure at the beginning of the second and third study day compared to the first study day.
Interestingly, in all three study groups, salivary concentrations of the inflammatory cytokines IL-1β, IL-6, IL-8, and TNF-α had significantly increased at the end of the experimental protocol compared to before the experimental protocol (positive Δ values in Figure 7). This increase in inflammatory cytokines in response to the experimental protocol was highly robust and consistently observed in all study participants. It has been demonstrated that acute stress [45], including mental stress [46], increases salivary IL-1β, IL-6, and TNF-α concentrations. Thus, it is not surprising that these salivary cytokines increased in response to our experimental protocol, which presumably was perceived as a stressful situation by most study participants. The increase in proinflammatory cytokines in response to the experimental protocol may be related to mobilization of preexisting cytokine pools rather than de novo synthesis because the time between saliva sampling was less than 2 h and because baseline levels on the second and third study days were not elevated compared with the first study day in any group. However, the lower baseline IL-6, IL-8, and TNF-α cytokine levels at the third study day compared with the first study day in the OA-D group may potentially be mediated by inhibition of cytokine de novo synthesis.
The hypothesis of this study was that noninvasive and nonpharmacologic interventions that have been suggested to increase parasympathetic tone [12], [13], [14], [15], [16], [19], [20], [21], [22] also activate the cholinergic antiinflammatory pathway [5], [6]. To test this hypothesis, we assessed autonomic function by HRV analysis and the immune response to OA-D and taVNS by determining salivary cytokine concentrations. RMSSD is a time-domain HRV parameter that has been considered a specific marker of parasympathetic modulation of sinus node function [11]. Only in the taVNS group, RMSSD increased significantly toward the end of the experimental protocol (pooled data in Figure 4), suggesting that taVNS increases cardiac parasympathetic tone. This finding is even more remarkable considering that BMI was higher in the taVNS group than in the time control group (Table 1) and that BMI is inversely correlated with RMSSD [47], [48]. Interestingly, OA-D but not taVNS application on the first study day resulted in elevated RMSSD during the initial baseline recording on the second study day (Figure 4). These findings suggest that OA-D has a delayed but prolonged effect on cardiac parasympathetic tone, while taVNS has a more immediate effect of shorter duration. This suggestion is supported by frequency-domain HRV analysis that demonstrated that high frequency spectral power of HRV, another specific measure of parasympathetic modulation of cardiac function [11], was elevated during the recovery recording at the end of the experimental protocol compared to the baseline recording only in the taVNS group (pooled data in Figure 5). In line with the finding for RMSSD, high frequency spectral power of HRV tended (p<0.10) to be elevated on the second and third study day compared to the first study day only in the OA-D group (Figure 5). Thus, the results of the HRV analysis is aligned with the notion that OA-D has a delayed but prolonged effect on parasympathetic tone, while taVNS exerts a more immediate effect of shorter duration.
The HRV analysis of our data confirms previous studies by others [12], [13], [14], [15], [16], [19], [20], [21], [22] suggesting that OA-D and taVNS increases parasympathetic modulation of cardiac function, although the time course of this effect seems to differ for OA-D and taVNS. Based on this finding, we addressed the question of whether this increased parasympathetic tone is associated with activation of the cholinergic antiinflammatory pathway [5], [6]. To address this question, we determined salivary cytokine concentrations before and after the experimental protocol on all three study days. Interestingly, the differential time courses of parasympathetic activation with OA-D and taVNS are in line with the time courses of the antiinflammatory effects of OA-D and taVNS. OA-D elicited delayed and prolonged effects on both the parasympathetic nervous system and salivary IL6, IL-8, and TNF-α levels that were only significant when the baseline cytokine levels on the third study day were compared with those from the first study day. In contrast, the effects of taVNS on parasympathetic function and on salivary cytokine levels were more acute. The effects of taVNS on IL-1β and its trend on TNF-α were only apparent as a blunted increase in cytokine levels in response to the acute experimental protocol (Figure 7). In addition, this effect of taVNS did not last into the next study day, because the baseline levels on the three study days did not differ in the taVNS group (Table 2). The consistent time courses of the parasympathetic and antiinflammatory responses, with delayed responses in the OA-D group and more acute responses in the taVNS group, further suggest that the antiinflammatory effects of OA-D and taVNS are linked to the activation of the parasympathetic nervous system and mediated through the cholinergic antiinflammatory pathway [5], [6].
While taVNS significantly (p<0.05) blunted the IL-1β response to the experimental protocol, there was only a trend (p<0.10) for reduced TNF-α responses with taVNS. It is generally assumed that an increase in IL-1β precedes the subsequent TNF-α response. It has been suggested that IL-1β induces TNF-α gene expression [49] and an increase in IL-1β plasma levels preceded TNF-α plasma levels in rats following a surgical intervention [50]. These different time courses for the IL-1β and TNF-α responses to proinflammatory stimuli may explain why the effect of taVNS on salivary IL-1β was statistically significant, while there was only a trend for the effect of taVNS on TNF-α.
Plasma levels of proinflammatory cytokines have been reported to be markedly elevated in patients with chronic inflammatory diseases, including rheumatoid arthritis [51], [52] and lupus [53]. Furthermore, it has been suggested that cytokine levels correlate with disease severity [52]. There is also data suggesting that cytokine levels in plasma correlate with those in saliva [54], [55]. Thus, it is reasonable to assume that salivary cytokine levels also correlate with clinical disease severity. Our finding that both OA-D and taVNS reduced salivary cytokines offers the possibility that these techniques may also reduce the markedly elevated plasma cytokine levels in patients with chronic inflammatory diseases, which may translate into less disease severity. While the results of our study are insufficient for this conclusion, they provide a rationale for a clinical follow-up study to test this hypothesis.
A secondary finding of this study was that OA-D performed on the first and second study days reduced mean (Figure 2) and diastolic blood pressure on the following study days, an effect that was not observed in the time control or taVNS groups. This antihypertensive effect of OA-D is consistent with findings by Curi et al. [16], who reported that the OMT technique of fourth ventricle compression decreased systolic and diastolic blood pressure in hypertensive study participants. In our study, the OMT technique of OA-D acutely reduced low frequency spectral power of systolic blood pressure, a measure of sympathetic modulation of vascular tone. Although this sympatholytic effect did not persist into the following study day, the acute reduction in vascular sympathetic tone may still have triggered an antihypertensive response through activation of local vasodilator mechanisms, such as the endothelial nitric oxide system or other mechanisms that persisted into the following day. Furthermore, OA-D increased baroreceptor-heart rate reflex sensitivity, an effect that persisted into the following study day. It is well established that an increase in baroreceptor reflex sensitivity can elicit antihypertensive effects [56], [57], [58], [59]. In fact, stimulating baroreflex afferents has recently been suggested as a therapeutic approach for treatment-resistant hypertension [60], [61]. Thus, the antihypertensive effect of OA-D may be the result of a combination of acutely reduced vascular sympathetic tone and chronically augmented baroreflex sensitivity.
Limitations
This study enrolled relatively healthy subjects who did not have known autoimmune illnesses or other diseases associated with a high degree of inflammation such as diabetes mellitus. Thus, this serves as a baseline study with which future studies can compare results to determine the efficacy of OA-D and/or taVNS in various disease states. Salivary instead of plasma cytokines were used to investigate the immune system response to OA-D or taVNS. The rationale for using salivary instead of plasma cytokine levels was that we wanted to assess the temporal pattern of cytokine levels over the three study days and the effect of our interventions on each study day. This would have required two blood draws on each of the three study days for a total of six blood draws per study participants. Such a protocol might have limited the willingness of volunteers to participate in the study. While we acknowledge that plasma cytokine levels would have been ideal, there are data demonstrating correlations between serum and salivary cytokine concentrations not only in conditions affecting the oral cavity [62] but also in response to systemic conditions, such as pediatric obesity [55] and sociocognitive stress [54]. Another limitation related is that salivary cytokine levels can increase substantially in patients with oral health issues [43], [44]. Some excessively high salivary cytokine levels were observed and subsequently identified as outliers and excluded from data analysis. While we did not assess oral health, it is possible that these outliers originated from study participants with oral health issues.
Conclusions
The results of this study suggest that the osteopathic technique of OA-D as well as non-invasive taVNS elicit antiinflammatory effects as indicated by a significantly blunted salivary IL-1β response to the experimental protocol in the taVNS group compared to the time-control group and by significantly reduced baseline levels of salivary IL-6, IL-8, and TNF-α on the third compared to the first study day in the OA-D group. It is reasonable to assume that these antiinflammatory effects of OA-D and taVNS are mediated through activation of the cholinergic antiinflammatory pathway, because both techniques were associated with increased time- and frequency-domain HRV parameters that reflect parasympathetic modulation of cardiac function. Furthermore, OA-D elicited an anti-hypertensive response that was reflected in a significant decrease in baseline mean and diastolic blood pressure on the second and third study days compared to the first study day. This antihypertensive effect of OA-D may be mediated by an acute inhibition of vascular sympathetic tone and/or chronic augmentation of baroreceptor reflex function. Taken together, the results of this study provide a rationale for conducting clinical studies that incorporate OMT techniques that elevate parasympathetic tone into the treatment plan for chronic inflammatory conditions, such as rheumatoid diseases or autoimmune disorders. Furthermore, the anti-hypertensive effect of OA-D observed in this study may be utilized as supplemental treatment in patients with hypertension. It appears important to conduct follow-up studies investigating the effects of OA-D and/or taVNS in patients with inflammatory or auto-immune diseases or in hypertensive patients, to test if the results obtained in this preliminary study in healthy participants translates into improved clinical outcomes in patients.
Funding source: Research Office of Burrell College of Osteopathic MedicineFunding source: American Osteopathic Association
Award Identifier / Grant number: 19137759
Reference
1. Strand, V, Kimberly, R, Isaacs, JD. Biologic therapies in rheumatology: lessons learned, future directions. Nat Rev Drug Discov 2007;6:75–92. https://doi.org/10.1038/nrd2196. Search in Google Scholar
2. Strand, V. The emerging role of biologics in rheumatic disease. J Rheumatol Suppl 1992;33:40–5. Search in Google Scholar
3. Joensuu, JT, Huoponen, S, Aaltonen, KJ, Konttinen, YT, Nordstrom, D, Blom, M. The cost-effectiveness of biologics for the treatment of rheumatoid arthritis: a systematic review. PLoS One 2015;10:e0119683. https://doi.org/10.1371/journal.pone.0119683. Search in Google Scholar
4. Singh, JA, Wells, GA, Christensen, R, Tanjong, Ghogomu E, Maxwell, L, MacDonald, JK, et al.. Adverse effects of biologics: a network meta-analysis and Cochrane overview. Cochrane Database Syst Rev 2011:Cd008794. https://doi.org/10.1002/14651858.CD008794.pub2. Search in Google Scholar
5. Tracey, KJ. Physiology and immunology of the cholinergic antiinflammatory pathway. J Clin Invest 2007;117:289–96. https://doi.org/10.1172/jci30555. Search in Google Scholar
6. Tracey, KJ. The inflammatory reflex. Nature 2002;420:853–9. https://doi.org/10.1038/nature01321. Search in Google Scholar
7. Rosas-Ballina, M, Ochani, M, Parrish, WR, Ochani, K, Harris, YT, Huston, JM, et al.. Splenic nerve is required for cholinergic antiinflammatory pathway control of TNF in endotoxemia. Proc Natl Acad Sci U S A 2008;105:11008–13. https://doi.org/10.1073/pnas.0803237105. Search in Google Scholar
8. Wang, H, Liao, H, Ochani, M, Justiniani, M, Lin, X, Yang, L, et al.. Cholinergic agonists inhibit HMGB1 release and improve survival in experimental sepsis. Nat Med 2004;10:1216–21. https://doi.org/10.1038/nm1124. Search in Google Scholar
9. Martelli, D, McKinley, MJ, McAllen, RM. The cholinergic anti-inflammatory pathway: a critical review. Auton Neurosci 2014;182:65–9. https://doi.org/10.1016/j.autneu.2013.12.007. Search in Google Scholar
10. Pavlov, VA, Ochani, M, Gallowitsch-Puerta, M, Ochani, K, Huston, JM, Czura, CJ, et al.. Central muscarinic cholinergic regulation of the systemic inflammatory response during endotoxemia. Proc Natl Acad Sci U S A 2006;103:5219–23. https://doi.org/10.1073/pnas.0600506103. Search in Google Scholar
11. Task Force of the European Society of Cardiology and the North American Society of Pacing and Electrophysiology. Heart rate variability: standards of measurement, physiological interpretation and clinical use. Task Force of the European Society of Cardiology and the North American Society of Pacing and Electrophysiology. Circulation 1996;93:1043–65. Search in Google Scholar
12. Ruffini, N, D’Alessandro, G, Mariani, N, Pollastrelli, A, Cardinali, L, Cerritelli, F. Variations of high frequency parameter of heart rate variability following osteopathic manipulative treatment in healthy subjects compared to control group and sham therapy: randomized controlled trial. Front Neurosci 2015;9:272. https://doi.org/10.3389/fnins.2015.00272. Search in Google Scholar
13. Fornari, M, Carnevali, L, Sgoifo, A. Single osteopathic manipulative therapy session dampens acute autonomic and neuroendocrine responses to mental stress in healthy male participants. J Am Osteopath Assoc 2017;117:559–67. https://doi.org/10.7556/jaoa.2017.110. Search in Google Scholar
14. Henley, CE, Ivins, D, Mills, M, Wen, FK, Benjamin, BA. Osteopathic manipulative treatment and its relationship to autonomic nervous system activity as demonstrated by heart rate variability: a repeated measures study. Osteopath Med Prim Care 2008;2:7. https://doi.org/10.1186/1750-4732-2-7. Search in Google Scholar
15. Giles, PD, Hensel, KL, Pacchia, CF, Smith, ML. Suboccipital decompression enhances heart rate variability indices of cardiac control in healthy subjects. J Altern Complement Med 2013;19:92–6. https://doi.org/10.1089/acm.2011.0031. Search in Google Scholar
16. Curi, ACC, Maior Alves, AS, Silva, JG. Cardiac autonomic response after cranial technique of the fourth ventricle (CV4) compression in systemic hypertensive subjects. J Bodyw Mov Ther 2018;22:666–72. https://doi.org/10.1016/j.jbmt.2017.11.013. Search in Google Scholar
17. Ellrich, J. Transcutaneous auricular vagus nerve stimulation. J Clin Neurophysiol 2019;36:437–42. https://doi.org/10.1097/wnp.0000000000000576. Search in Google Scholar
18. Butt, MF, Albusoda, A, Farmer, AD, Aziz, Q. The anatomical basis for transcutaneous auricular vagus nerve stimulation. J Anat 2019. https://doi.org/10.1111/joa.13122. Search in Google Scholar
19. Bretherton, B, Atkinson, L, Murray, A, Clancy, J, Deuchars, S, Deuchars, J. Effects of transcutaneous vagus nerve stimulation in individuals aged 55 years or above: potential benefits of daily stimulation. Aging 2019;11:4836–57. https://doi.org/10.18632/aging.102074. Search in Google Scholar
20. Kampusch, S, Kaniusas, E, Szeles, JC. Modulation of muscle tone and sympathovagal balance in cervical dystonia using percutaneous stimulation of the auricular vagus nerve. Artif Organs 2015;39:E202–212. https://doi.org/10.1111/aor.12621. Search in Google Scholar
21. Clancy, JA, Mary, DA, Witte, KK, Greenwood, JP, Deuchars, SA, Deuchars, J. Non-invasive vagus nerve stimulation in healthy humans reduces sympathetic nerve activity. Brain Stimul 2014;7:871–7. https://doi.org/10.1016/j.brs.2014.07.031. Search in Google Scholar
22. Antonino, D, Teixeira, AL, Maia-Lopes, PM, Souza, MC, Sabino-Carvalho, JL, Murray, AR, et al.. Non-invasive vagus nerve stimulation acutely improves spontaneous cardiac baroreflex sensitivity in healthy young men: a randomized placebo-controlled trial. Brain Stimul 2017;10:875–81. https://doi.org/10.1016/j.brs.2017.05.006. Search in Google Scholar
23. Liu, CH, Yang, MH, Zhang, GZ, Wang, XX, Li, B, Li, M, et al.. Neural networks and the anti-inflammatory effect of transcutaneous auricular vagus nerve stimulation in depression. J Neuroinflammation 2020;17:54. https://doi.org/10.1186/s12974-020-01732-5. Search in Google Scholar
24. Hong, GS, Zillekens, A, Schneiker, B, Pantelis, D, de Jonge, WJ, Schaefer, N, et al.. Non-invasive transcutaneous auricular vagus nerve stimulation prevents postoperative ileus and endotoxemia in mice. Neuro Gastroenterol Motil 2019;31:e13501. https://doi.org/10.1111/nmo.13501. Search in Google Scholar
25. Jiang, Y, Cao, Z, Ma, H, Wang, G, Wang, X, Wang, Z, et al.. Auricular vagus nerve stimulation exerts antiinflammatory effects and immune regulatory function in a 6-OHDA model of Parkinson’s disease. Neurochem Res 2018;43:2155–64. https://doi.org/10.1007/s11064-018-2639-z. Search in Google Scholar
26. Cicchitti, L, Martelli, M, Cerritelli, F. Chronic inflammatory disease and osteopathy: a systematic review. PLoS One 2015;10:e0121327. https://doi.org/10.1371/journal.pone.0121327. Search in Google Scholar
27. Yorgun, H, Canpolat, U, Aytemir, K, Ateş, AH, Kaya, EB, Akdoğan, A, et al.. Evaluation of cardiac autonomic functions in patients with systemic lupus erythematosus. Lupus 2012;21:373–9. https://doi.org/10.1177/0961203311425518. Search in Google Scholar
28. Koopman, FA, van Maanen, MA, Vervoordeldonk, MJ, Tak, PP. Balancing the autonomic nervous system to reduce inflammation in rheumatoid arthritis. J Intern Med 2017;282:64–75. https://doi.org/10.1111/joim.12626. Search in Google Scholar
29. DeStefano, LA. Greenman’s principles of manual medicine. Baltimore, MD: Lippincott Williams & Wilkins; 2011. Search in Google Scholar
30. He, W, Wang, X, Shi, H, Shang, H, Li, L, Jing, X, et al.. Auricular acupuncture and vagal regulation. Evid Based Complement Alternat Med 2012;2012:786839. https://doi.org/10.1155/2012/786839. Search in Google Scholar
31. Badran, BW, Mithoefer, OJ, Summer, CE, LaBate, NT, Glusman, CE, Badran, AW, et al.. Short trains of transcutaneous auricular vagus nerve stimulation (taVNS) have parameter-specific effects on heart rate. Brain Stimul 2018;11:699–708. https://doi.org/10.1016/j.brs.2018.04.004. Search in Google Scholar
32. Bertinieri, G, Di Rienzo, M, Cavallazzi, A, Ferrari, AU, Pedotti, A, Mancia, G. A new approach to analysis of the arterial baroreflex. J Hypertens 1985;3(Suppl 3):S79–81. Search in Google Scholar
33. Stauss, HM. HemoLab software. http://www.haraldstauss.com/HaraldStaussScientific/hemolab. Search in Google Scholar
34. Stauss, HM, Moffitt, JA, Chapleau, MW, Abboud, FM, Johnson, AK. Baroreceptor reflex sensitivity estimated by the sequence technique is reliable in rats. Am J Physiol Heart Circ Physiol 2006;291:H482–3. https://doi.org/10.1152/ajpheart.00228.2006. Search in Google Scholar
35. Smyth, HS, Sleight, P, Pickering, GW. Reflex regulation of arterial pressure during sleep in man. A quantitative method of assessing barorelex sensitivity. Circ Res 1969;24:109–21. https://doi.org/10.1161/01.res.24.1.109. Search in Google Scholar
36. Julien, C, Malpas, SC, Stauss, HM. Sympathetic modulation of blood pressure variability. J Hypertens 2001;19:1707–12. https://doi.org/10.1097/00004872-200110000-00002. Search in Google Scholar
37. Stauss, HM. Identification of blood pressure control mechanisms by power spectral analysis. Clin Exp Pharmacol Physiol 2007;34:362–8. https://doi.org/10.1111/j.1440-1681.2007.04588.x. Search in Google Scholar
38. Chambers, JM. Software for data analysis: programming with R (statistics and computing). New York: Springer; 2008. Search in Google Scholar
39. Cohen, J. A power primer. Psychol Bull 1992;112:155–9. https://doi.org/10.1037//0033-2909.112.1.155. Search in Google Scholar
40. Stauss, HM, Kregel, KC. Frequency response characteristic of sympathetic-mediated vasomotor waves in conscious rats. Am J Physiol 1996;271:H1416–22. https://doi.org/10.1152/ajpheart.1996.271.4.H1416. Search in Google Scholar
41. Stauss, HM, Anderson, EA, Haynes, WG, Kregel, KC. Frequency response characteristics of sympathetically-mediated vasomotor waves in humans. Am J Physiol 1998;274:H1277–83. https://doi.org/10.1152/ajpheart.1998.274.4.H1277. Search in Google Scholar
42. Proctor, GB, Carpenter, GH. Regulation of salivary gland function by autonomic nerves. Auton Neurosci 2007;133:3–18. https://doi.org/10.1016/j.autneu.2006.10.006. Search in Google Scholar
43. Kaczyński, T, Wroński, J, Głuszko, P, Kryczka, T, Miskiewicz, A, Górski, B, et al.. Salivary interleukin 6, interleukin 8, interleukin 17A, and tumour necrosis factor α levels in patients with periodontitis and rheumatoid arthritis. Cent Eur J Immunol 2019;44:269–76. https://doi.org/10.5114/ceji.2019.89601. Search in Google Scholar
44. Riis, JL, Ahmadi, H, Hamilton, KR, Hand, T, Granger, DA. Best practice recommendations for the measurement and interpretation of salivary proinflammatory cytokines in biobehavioral research. Brain Behav Immun 2020. https://doi.org/10.1016/j.bbi.2020.09.009. Search in Google Scholar
45. Slavish, DC, Graham-Engeland, JE, Smyth, JM, Engeland, CG. Salivary markers of inflammation in response to acute stress. Brain Behav Immun 2015;44:253–69. https://doi.org/10.1016/j.bbi.2014.08.008. Search in Google Scholar
46. Maydych, V, Claus, M, Watzl, C, Kleinsorge, T. Attention to emotional information is associated with cytokine responses to psychological stress. Front Neurosci 2018;12:687. https://doi.org/10.3389/fnins.2018.00687. Search in Google Scholar
47. Koenig, J, Jarczok, MN, Warth, M, Ellis, RJ, Bach, C, Hillecke, TK, et al.. Body mass index is related to autonomic nervous system activity as measured by heart rate variability – a replication using short term measurements. J Nutr Health Aging 2014;18:300–2. https://doi.org/10.1007/s12603-014-0022-6. Search in Google Scholar
48. Mehta, RK. Impacts of obesity and stress on neuromuscular fatigue development and associated heart rate variability. Int J Obes2015;39:208–13. https://doi.org/10.1038/ijo.2014.127. Search in Google Scholar
49. Bethea, JR, Gillespie, GY, Benveniste, EN. Interleukin-1 beta induction of TNF-alpha gene expression: involvement of protein kinase C. J Cell Physiol 1992;152:264–73. https://doi.org/10.1002/jcp.1041520207. Search in Google Scholar
50. Loram, LC, Themistocleous, AC, Fick, LG, Kamerman, PR. The time course of inflammatory cytokine secretion in a rat model of postoperative pain does not coincide with the onset of mechanical hyperalgesia. Can J Physiol Pharmacol 2007;85:613–20. https://doi.org/10.1139/y07-054. Search in Google Scholar
51. Azizieh, FY, Al Jarallah, K, Shehab, D, Gupta, R, Dingle, K, Raghupathy, R. Patterns of circulatory and peripheral blood mononuclear cytokines in rheumatoid arthritis. Rheumatol Int 2017;37:1727–34. https://doi.org/10.1007/s00296-017-3774-6. Search in Google Scholar
52. Koopman, FA, Chavan, SS, Miljko, S, Grazio, S, Sokolovic, S, Schuurman, PR, et al.. Vagus nerve stimulation inhibits cytokine production and attenuates disease severity in rheumatoid arthritis. Proc Natl Acad Sci U S A 2016;113:8284–9. https://doi.org/10.1073/pnas.1605635113. Search in Google Scholar
53. Guimarães, PM, Scavuzzi, BM, Stadtlober, NP, Franchi, Santos L, Lozovoy, MAB, Iriyoda, TMV, et al.. Cytokines in systemic lupus erythematosus: far beyond Th1/Th2 dualism lupus: cytokine profiles. Immunol Cell Biol 2017;95:824–31. https://doi.org/10.1038/icb.2017.53. Search in Google Scholar
54. La Fratta, I, Tatangelo, R, Campagna, G, Rizzuto, A, Franceschelli, S, Ferrone, A, et al.. The plasmatic and salivary levels of IL-1β, IL-18 and IL-6 are associated to emotional difference during stress in young male. Sci Rep 2018;8:3031. https://doi.org/10.1038/s41598-018-21474-y. Search in Google Scholar
55. Pîrsean, C, Negut, C, Stefan-van Staden, RI, Dinu-Pirvu, CE, Armean, P, Udeanu, DI. The salivary levels of leptin and interleukin-6 as potential inflammatory markers in children obesity. PLoS One 2019;14:e0210288. https://doi.org/10.1371/journal.pone.0210288. Search in Google Scholar
56. Barrett, CJ, Malpas, SC. Problems, possibilities, and pitfalls in studying the arterial baroreflexes’ influence over long-term control of blood pressure. Am J Physiol Regul Integr Comp Physiol 2005;288:R837–45. https://doi.org/10.1152/ajpregu.00456.2004. Search in Google Scholar
57. Floras, JS, Hassan, MO, Jones, JV, Osikowska, BA, Sever, PS, Sleight, P. Consequences of impaired arterial baroreflexes in essential hypertension: effects on pressor responses, plasma noradrenaline and blood pressure variability. J Hypertens 1988;6:525–35. https://doi.org/10.1097/00004872-198807000-00003. Search in Google Scholar
58. Head, GA. Cardiac baroreflexes and hypertension. Clin Exp Pharmacol Physiol 1994;21:791–802. https://doi.org/10.1111/j.1440-1681.1994.tb02448.x. Search in Google Scholar
59. Head, GA. Baroreflexes and cardiovascular regulation in hypertension. J Cardiovasc Pharmacol 1995;26(Suppl 2):S7–16. Search in Google Scholar
60. Jordan, J, Heusser, K, Brinkmann, J, Tank, J. Electrical carotid sinus stimulation in treatment resistant arterial hypertension. Auton Neurosci 2012;172:31–6. https://doi.org/10.1016/j.autneu.2012.10.009. Search in Google Scholar
61. Lohmeier, TE, Iliescu, R. Chronic lowering of blood pressure by carotid baroreflex activation: mechanisms and potential for hypertension therapy. Hypertension 2011;57:880–6. https://doi.org/10.1161/HYPERTENSIONAHA.108.119859. Search in Google Scholar
62. Bagan, L, Sáez, GT, Tormos, MC, Labaig-Rueda, C, Murillo-Cortes, J, Bagan, JV. Salivary and serum interleukin-6 levels in proliferative verrucous leukoplakia. Clin Oral Invest 2016;20:737–43. https://doi.org/10.1007/s00784-015-1551-z. Search in Google ScholarReceived: 2020-03-26Accepted: 2020-11-09
Published Online: 2021-02-24